Sachait’s_Portfolio
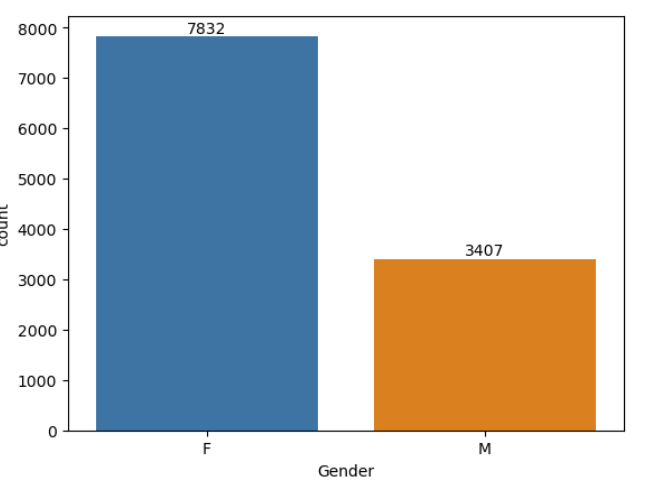
### PROJECT 1- Diwali_Sales_analysis_project : PROJECT OVERVIEW
-
Objective: To analyze Diwali sales data and identify key customer purchasing patterns.
-
Solution: Performed EDA to assess sales by gender, age, marital status, state, occupation, and product category, highlighting top spending groups and popular product categories.
-
Key Achievement: Effectively visualized Diwali sales data, uncovering key insights on customer behavior and spending patterns, making it accessible and actionable for targeted marketing strategies.
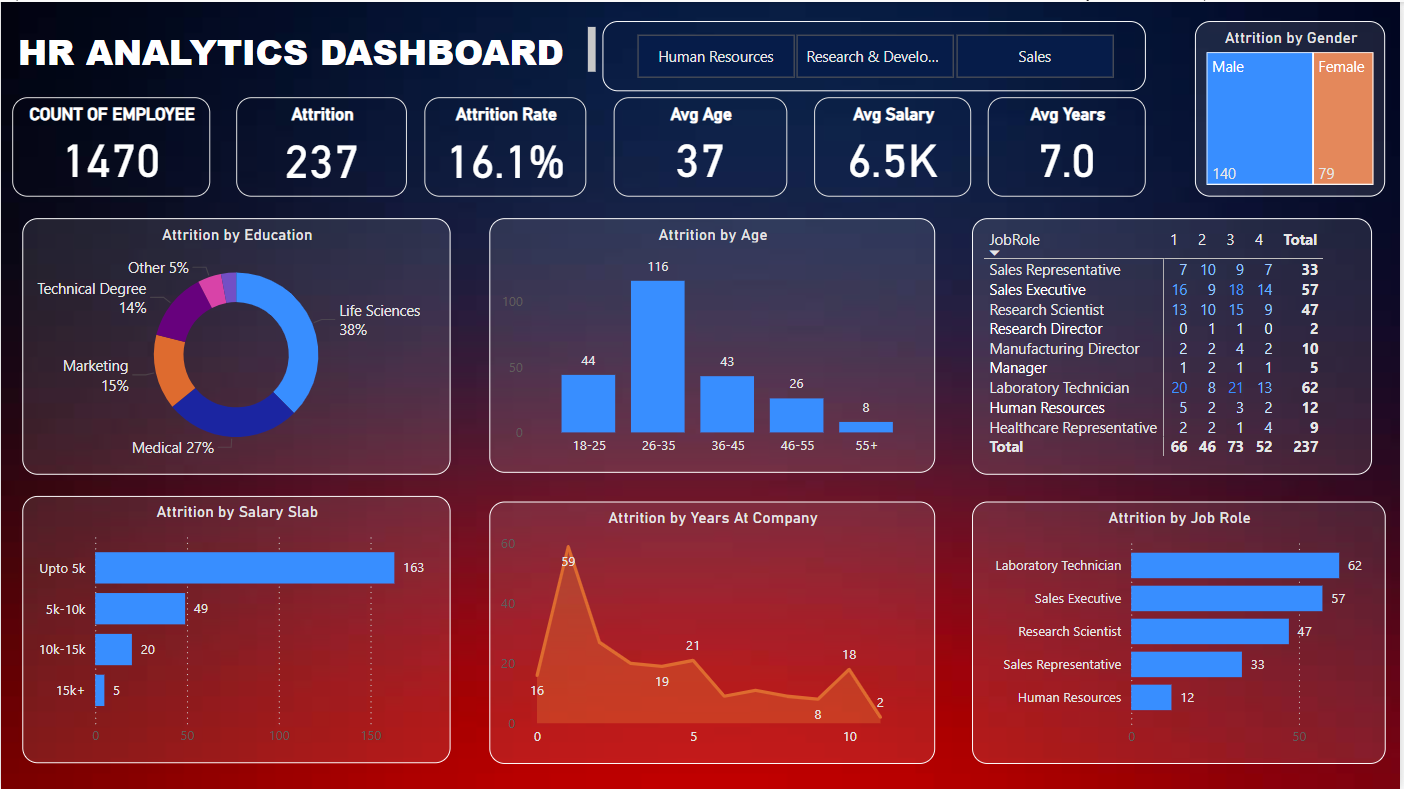
PROJECT 2 -HR_Analytics_Dashboard
- Objective: To create a Power BI dashboard that analyzes employee attrition and uncovers key factors influencing turnover, such as age, salary, tenure, and job roles..
-
Solution: Cleaned and prepared data using Power Query Editor, calculated key metrics (attrition rate, average salary, etc.) with DAX, and visualized insights using various charts to identify trends in employee attrition.
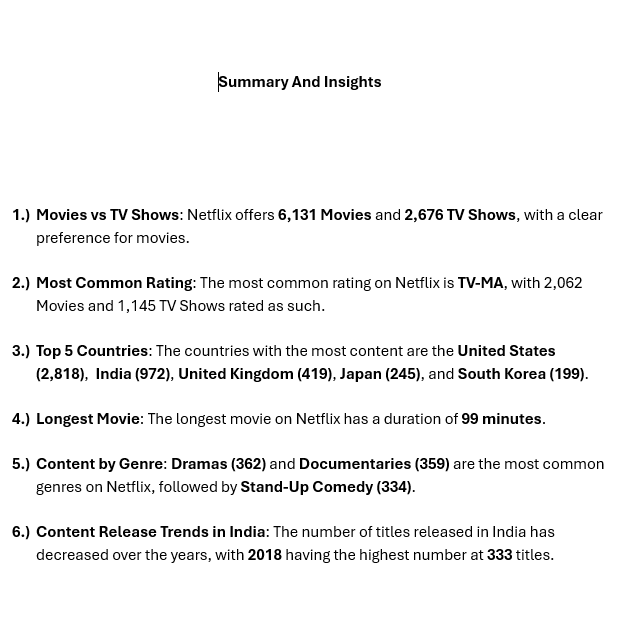
PROJECT 3 - Netlix_Analysis_SQL
- Objective: To analyze Netflix’s content distribution, ratings, release trends, and geographical preferences using SQL.
- Solution: Conducted detailed queries to determine the distribution of Movies vs TV Shows, identify common ratings, explore content by release years and countries, and assess content
duration and genres for business insights.
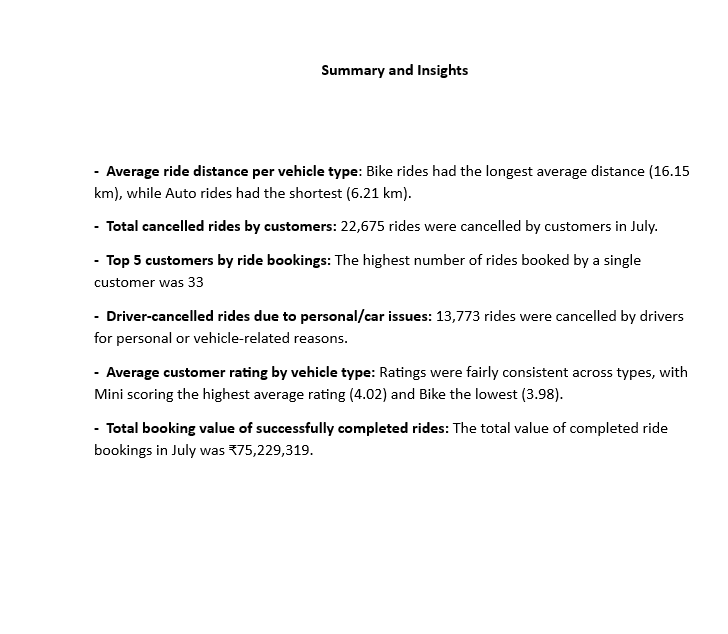
PROJECT 4 - Ola_Analysis_SQL
- Objective: To analyze Ola’s ride data for July 2024, focusing on booking success, vehicle performance, cancellations, customer behavior, and payment methods.
-
Solution: Conducted SQL queries to analyze successful bookings, average ride distance by vehicle type, reasons for cancellations, top customers, payment methods (especially UPI), and ratings to drive business insights and service optimization.
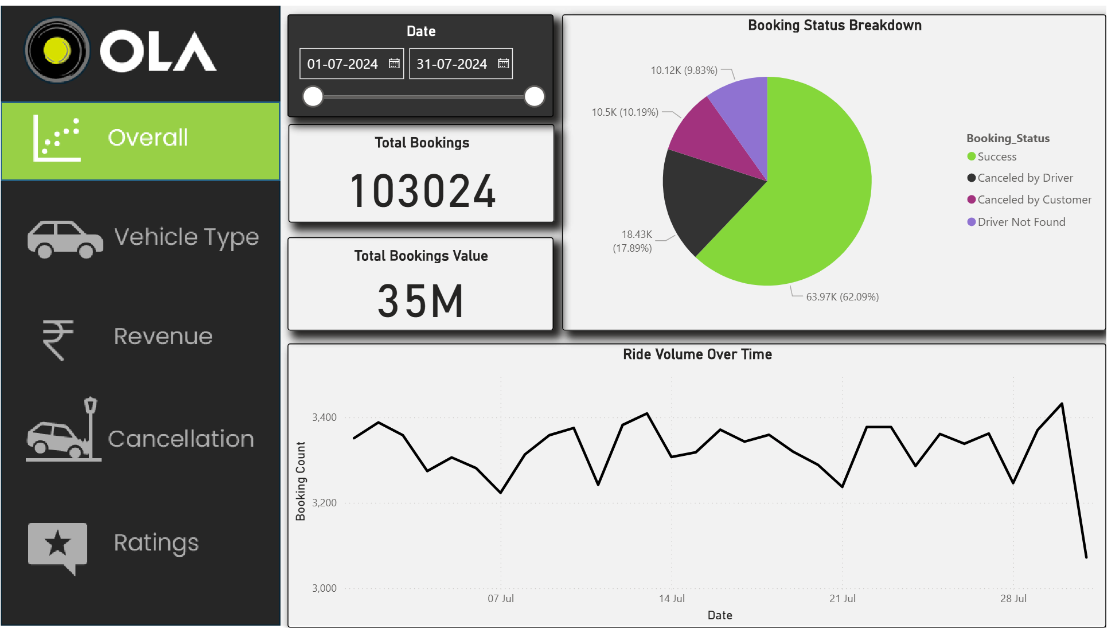
PROJECT 5 - Ola-Power-BI-Project
-
Objective: To analyze Ola’s ride bookings for July 2024, focusing on booking trends, payment behavior, cancellations, revenue, customer behavior, and ratings through a Power BI dashboard.
- Solution: Developed a Power BI report to visualize ride volume, booking status, revenue by payment method, top customers, and cancellation reasons, offering actionable insights for service optimization and customer satisfaction.